Research data MCP for Trae
Add ScholarMuse under Settings > MCP in Trae and sign in in your browser. The agent can then bring datasets, official statistics and discipline records into the analysis code it writes.
How to connect ScholarMuse to Trae
Trae comes in two builds: Trae CN (trae.cn) and the international build (trae.ai). Trae CN documents a one-click install link and the full MCP browser authorization. For the international build, add the server manually and use the fallback below if no authorization opens. These steps follow the Trae documentation.
Step 1
Trae CN: use the install link
Open this link on the computer where Trae CN is installed. Trae CN shows a confirmation dialog; confirm to add the server.
trae-cn://trae.ai-ide/mcp-import?type=http&name=scholarmuse&config=eyJ1cmwiOiJodHRwczovL3NjaG9sYXJtdXNlLmFpL21jcCJ9Step 2
Either build: add it manually
Go to Settings > MCP, choose Add > Add Manually and paste this JSON. In the Agent window, set the run environment to local, not cloud.
{
  "mcpServers": {
    "scholarmuse": {
      "url": "https://scholarmuse.ai/mcp"
    }
  }
}
Step 3
Approve in your browser
A scholarmuse.ai window opens. Sign in, approve access and choose which discipline packs Trae may use. There is no API key to create or paste.
Step 4
If no authorization opens
This can happen in the international build, whose documentation does not confirm browser authorization for MCP servers. Use this configuration in its place. It runs mcp-remote on your computer, which opens the sign-in itself, and needs Node.js 18 or later.
{
  "mcpServers": {
    "scholarmuse": {
      "command": "npx",
      "args": [
        "-y",
        "mcp-remote",
        "https://scholarmuse.ai/mcp"
      ]
    }
  }
}
Step 5
Check that it works
Ask the Trae agent to list the ScholarMuse capabilities. If it cannot see them, check that the server is switched on under Settings > MCP and that the run environment is local.
What Trae can fetch once connected
Trae is an IDE, and research work in it is mostly analysis scripts and notebooks. The list therefore starts with data the code can read, then the papers and references that belong in the write-up.

Find datasets
All disciplines · DataCite, Zenodo, Dryad +2
Economic & social statistics
All disciplines · FRED, World Bank, IMF +5
Search papers
All disciplines · OpenAlex, PubMed / Europe PMC, arXiv +5
 New
NewHistorical weather data for any place
Earth & environment · NASA POWER
Compounds & materials
Chemistry & materials · PubChem, ChEBI, Materials Project +2
 New
NewGene & protein lookup
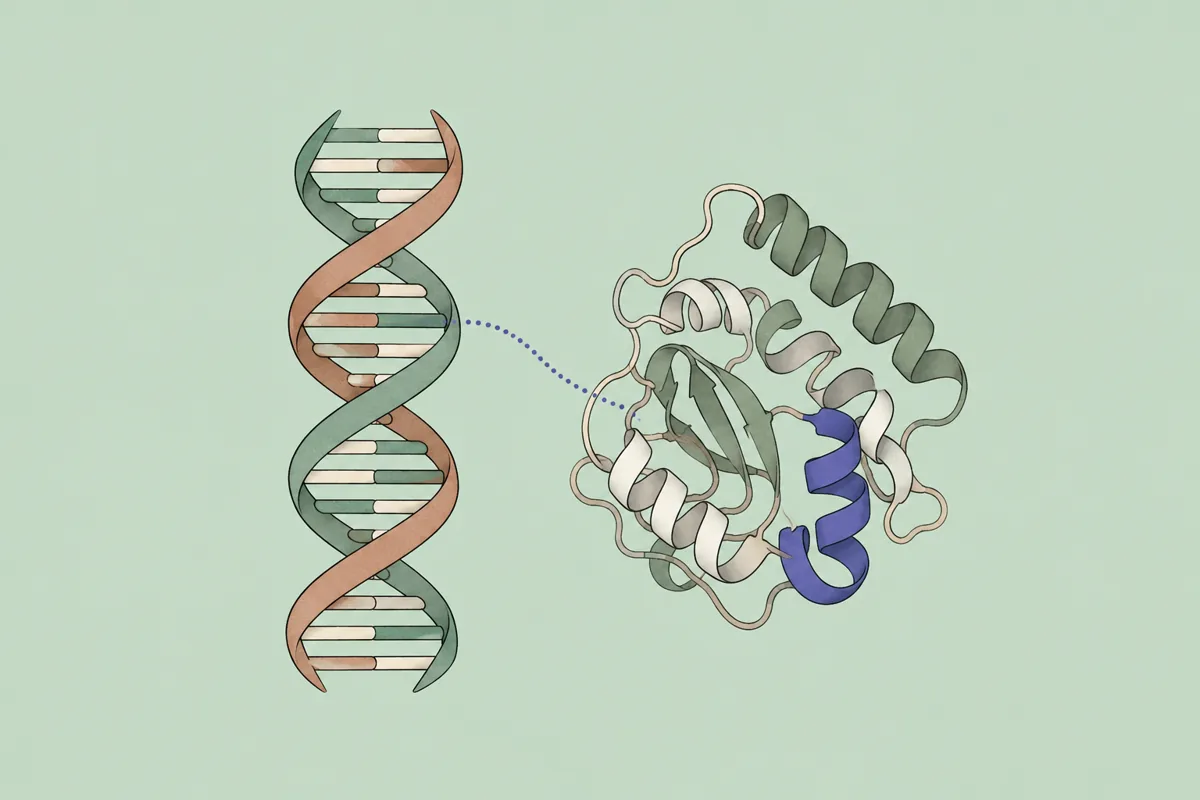
Life sciences & medicine · NCBI Gene, Ensembl, UniProt +5

Species occurrence
Earth & environment · GBIF

Verify references
All disciplines · Crossref, OpenAlex
- Find datasets
- Ask for candidate datasets first, compare licence and size, then let Trae write the download and loading code for the one you pick.
- Economic & social statistics
- Macro and social series arrive with unit and source, so a panel for a regression is built from official figures.
- Search papers
- Look up the paper that defines the model or metric you are coding, and keep its DOI in the docstring.
- Historical weather data for any place
- Daily temperature, precipitation and radiation for a field site or a city, from 1981 on, as input for a crop or energy model.
- Compounds & materials
- Properties from PubChem and crystal data such as band gaps, pulled into a table for screening scripts.
- Gene & protein lookup
- Annotate a gene list from a differential expression analysis with function, pathways and tissue expression.
- Species occurrence
- Openly licensed GBIF occurrence records as points for a species distribution model.
- Verify references
- Check the bibliography of a project README, a report or a LaTeX file in the repository before you share it.
Things to ask Trae
Find datasets
You say to your agent
Use ScholarMuse to find openly licensed remote sensing datasets for crop type classification. Compare licence, size and format, then write a PyTorch Dataset class for the one I choose.
Economic & social statistics
You say to your agent
Get annual GDP per capita and urban population share for China, India and Vietnam from 1990 to 2023, save them as one long-format CSV, and run a fixed-effects regression in Python.
Historical weather data for any place
You say to your agent
Fetch daily precipitation for 30.59 N, 114.31 E from 2000 to 2023 and count the days above 50 mm in each year. Plot the result.
Frequently asked questions
Ready to make your agent a better scholar?
Connect once. Papers, data and figures from 50+ sources, in the agent you already use.
Works with compatible AI agents
Data from OpenAlex · Crossref · PubMed · arXiv · NIH · UniProt · PDB · PubChem · NASA · World Bank · USGS · GBIF and more