ONLINE TOOL · SIGN IN TO USE
AI graphical abstract maker
Paste your abstract and an image model draws a one-panel graphical abstract from it.
Needs an account. 20 credits per finished figure; new accounts start with 50 credits. Takes 1–2 minutes.
Input
Results
Your figure will appear here. See the example image below
How the graphical abstract maker works
- 1
Sign in and paste your abstract
Paste the abstract, or describe the story in a few sentences: what the entities are, how they relate and in what order things happen. The text needs at least 20 characters, and the first 3,000 are used.
- 2
An image model draws it
Your text is sent to an image model with instructions for a journal graphical abstract: one landscape 16:9 panel that tells the story in three or four stages, on a white background, with short labels only.
- 3
Open the figure
The image appears in the result panel after one to two minutes as a JPEG and is also saved under Files in your dashboard. If it is still rendering when the page stops waiting, you will find it there.
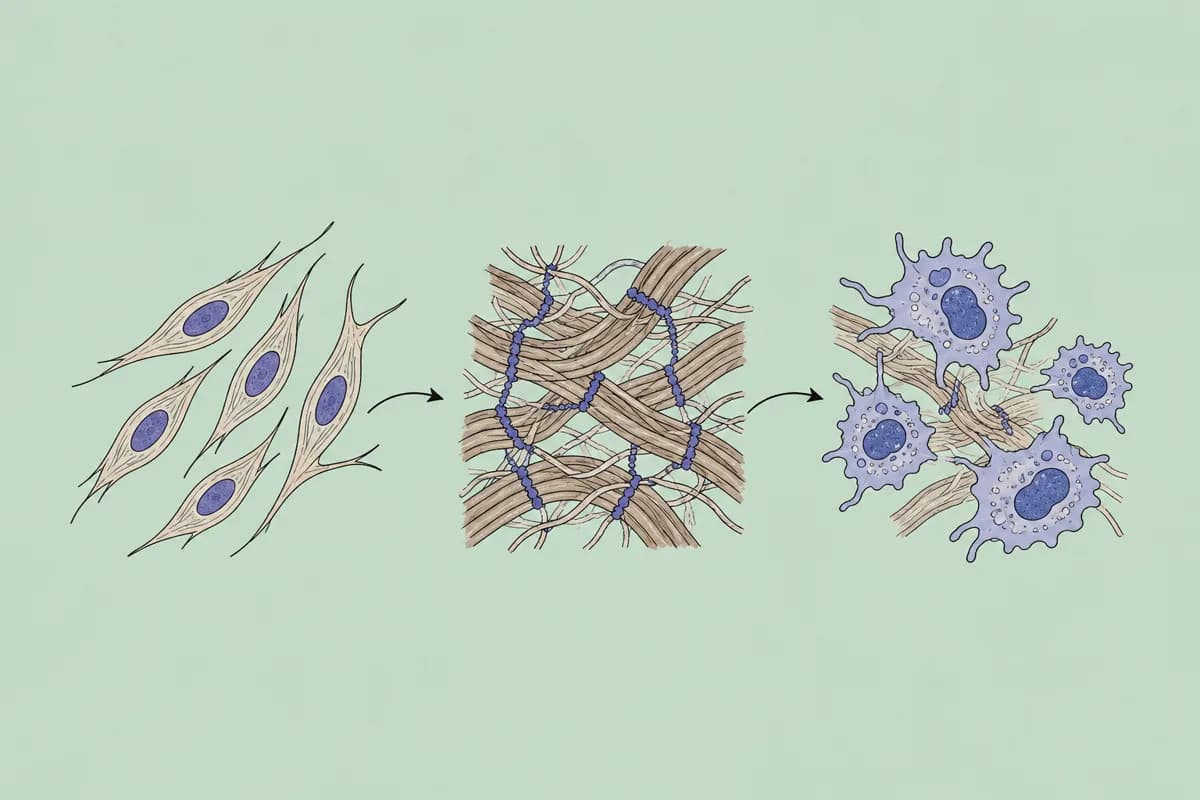
Example image
This is an example image, not the output of a run on this page: it is the illustration from our graphical abstract capability page, on the same subject as the example input above. A figure made here is a 16:9 panel, usually with short text labels, and will look different.
Example input
TGF-beta activates fibroblasts, which stiffen the extracellular matrix and recruit macrophages, driving lung fibrosis.
Example image (not a run of this page)
What a graphical abstract is, and what journals ask for
A graphical abstract is a single image that sums up a paper’s main finding so that a reader can take it in at a glance. Many journals invite or require one at submission.
Requirements differ from journal to journal: pixel size, aspect ratio, file format, font size. This tool produces one landscape 16:9 JPEG and does not resize or reformat it to a journal’s specification, so check your target journal’s author guidelines and adjust the file if needed.
What to write so the figure comes out right
The model draws what the text says, so the clearer the story, the better the figure. A full abstract works, but a few plain sentences often work better:
- Name the entities: cells, molecules, devices, groups of participants.
- State how they relate: activates, inhibits, binds, is compared with.
- Give the order of events, from the starting point to the outcome.
What to check before you use the figure
The figure is drawn by an image model from your text. Nothing in it is looked up in a database or checked against the literature, so you are the reviewer. Check every label for spelling, every arrow for direction, and every shape against what your paper actually shows.
Check your journal’s policy on AI-generated images as well; some restrict them or ask for disclosure. This page has no edit step: to change a figure with an instruction such as “make the arrows thicker”, use the figure tools through your agent.
FAQ
Related tools
- Free citation checker
Check the reference list of the same manuscript before you submit.
- Free journal checker
Look up the target journal’s open-access status, DOAJ listing and APC.
- Graphical abstracts made by your AI agent
The same figure model, with a choice of style, aspect ratio and labels, and edits by instruction.
The same figure, made inside Claude or ChatGPT
Connect ScholarMuse once and your agent can read your draft, write the description, make the figure and revise it when you ask. Figures cost the same credits there.